A form could collect the answers. The research needed to make room for the hesitation before them.
The Space Before the Answer is a participatory research instrument about how creative practitioners think alongside AI. I turned the research premise into a 12-question journey, a bounded two-axis result, a live constellation, a 17-slide data story, and a self-service response-import workflow.
- My contribution
- Product architecture, interaction, visualization, engineering, deployment, and handoff
- Collaboration
- The research partner owned the question, survey language, profile meaning, and color direction
- Research model
- 12 questions, 2 axes, 8 profiles, and 10 metaphor signs
- Stack
- Vite, TypeScript, Canvas, GSAP, Supabase, Zod, and Vitest

A survey, a personal reflection, and a shared field of evidence.
The product does three jobs in sequence. It gathers individual answers, returns a careful interpretation to the participant, and lets the research owner read the aggregate patterns without separating the data from the experience.
A standard form would make the interaction efficient. The design problem was to slow it down enough for people to notice their own ambivalence without turning the research into theatre.
The meaning was collaborative. The product system was my responsibility.
The real repository includes an editing guide and a self-service upload route because the project had to remain usable after handoff.
Question and interpretation
Research premise, survey wording, eight profile meanings, ten metaphor signs, and the near-black, cream, and profile-color direction.
Interaction and machinery
Product architecture, question pacing, screen router, classification, Canvas field, aggregate instruments, Supabase path, CSV import, validation, documentation, and deployment.
The participant experience and the research operation share one system.
The map keeps the visible journey, the research story, maintenance, data, and handoff distinct. It shows what belongs to the product before the flows show how a person moves through it.
Participant
- Introduction
- 12-question survey
- Processing
- Profile
- Star sign
- Constellation
Research story
- Overview
- 8 chapters
- 8 instruments
- Respondent field
Operations
- Admin entry
- Upload CSV
- Validate
- Preview
- Insert
Data layer
- 55-response seed
- Supabase
- 60-second poll
- Email delivery
Handoff
- Editing guide
- Decision record
- Deployment
- Recovery path
Collect, calculate, return, connect.
The Mews presentation reduced the product to this proof path. The live site confirms each state and keeps progress, back navigation, and anonymous-data guidance visible.
- 01
Frame
Explain the premise, effort, and anonymous-data use before asking for an answer.
- 02
Answer
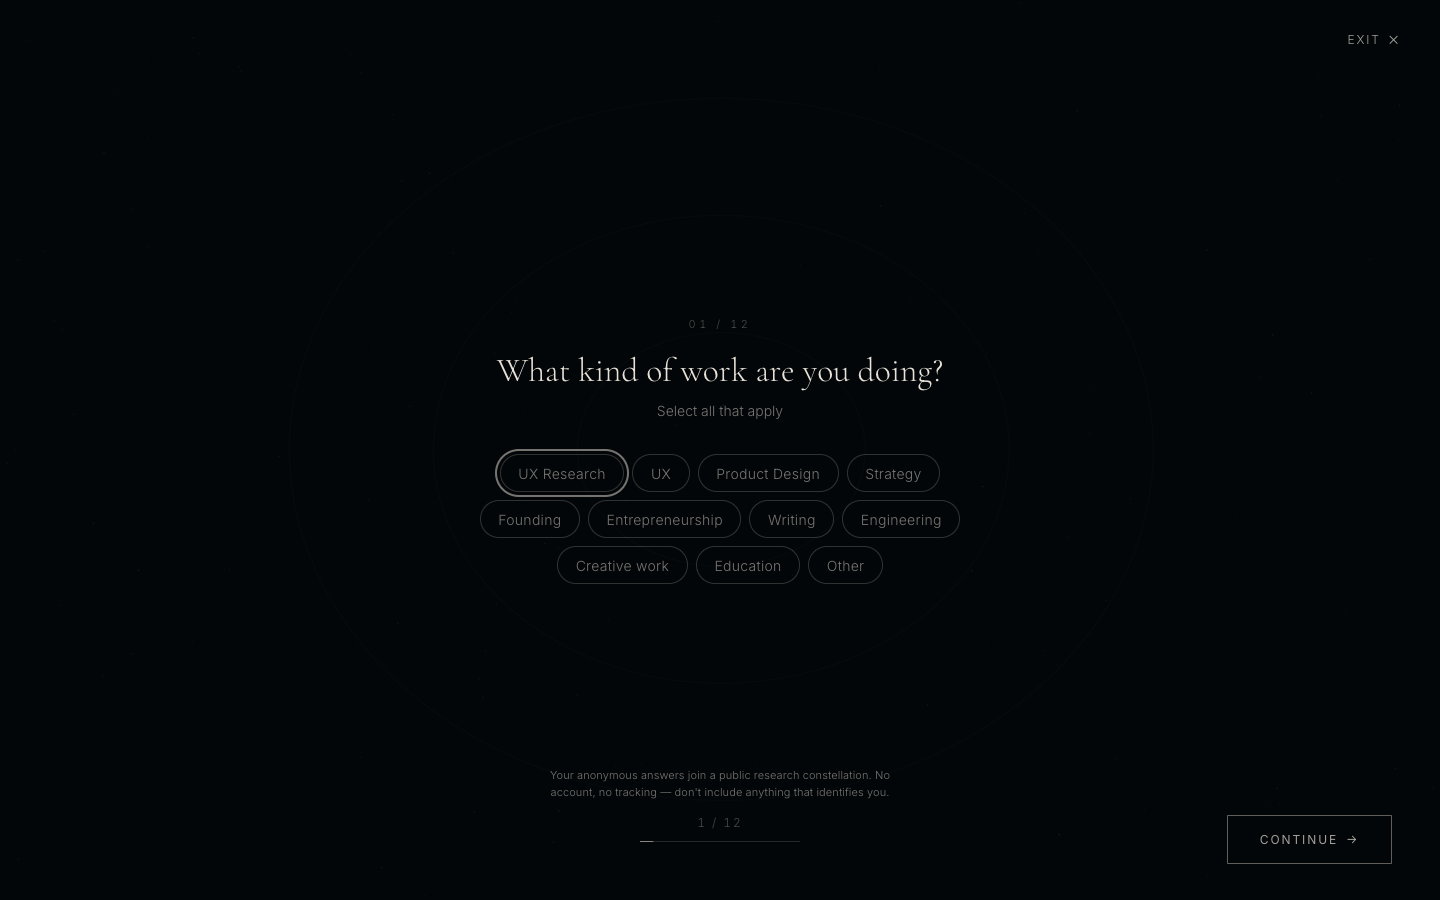
Move through 12 questions with one topic, one control, and visible progress at a time.
Branch: Back preserves completed answers; incomplete questions remain editable. - 03
Calculate
Convert selected answers into delegation and tension coordinates.
- 04
Reflect
Return one bounded profile and one metaphor sign without presenting a diagnosis.
- 05
Join
Add the participant as a star in the anonymous respondent field.
- 06
Interpret
Explore the constellation or continue into the aggregate research story.
Branch: If Supabase is unavailable, retain the seeded field and the current-session result.
Recovery: the 55 real seeded responses render the field before the database client loads. If Supabase is unavailable, the participant can still complete the journey and join the local constellation for the current session.
Six change-points carry the participant from premise to shared evidence.
The frames keep the same shell while the task changes. Each one identifies the purpose, primary action, and states that must survive before color, motion, or data visualization are added.
/- Purpose
- Set expectations and explain anonymous-data use before the first question.
- Primary action
- Begin the study
- States
- Default, consent note, reduced motion
/survey?step=4- Purpose
- Keep attention on one decision while preserving progress and back navigation.
- Primary action
- Answer and continue
- States
- Unanswered, selected, required, restored
/processing- Purpose
- Bridge the survey and result without implying certainty or losing the answers.
- Primary action
- Wait for the bounded result
- States
- Calculating, delayed, local fallback
/profile- Purpose
- Place the participant on two axes and explain the limits of the interpretation.
- Primary action
- See the participant star
- States
- Profile, sign, long explanation
/web- Purpose
- Put the participant inside the same anonymous field as the research pool.
- Primary action
- Explore a neighboring response
- States
- Seeded, live, selected, network unavailable
/data- Purpose
- Answer one research question per slide instead of presenting a dashboard dump.
- Primary action
- Move to the next instrument
- States
- Overview, chapter, instrument, no live client
Two axes create eight bounded positions.
The model describes a relationship to AI inside this study. It does not diagnose personality. The code calculates delegation on X and tension on Y, then assigns a named region.
The Sentinel
delegation < .30
tension ≥ .45
The Expedition Leader
delegation .30 to .55
tension ≥ .45
The Translator
delegation .55 to .75
tension ≥ .65
The Double Agent
delegation ≥ .75
tension ≥ .50
The Cartographer
delegation < .30
tension < .45
The Astronomer
delegation .30 to .55
tension < .45
The Navigator
delegation .55 to .75
tension < .65
The Accelerant
delegation ≥ .75
tension < .50
The visual language is part of the research pacing.
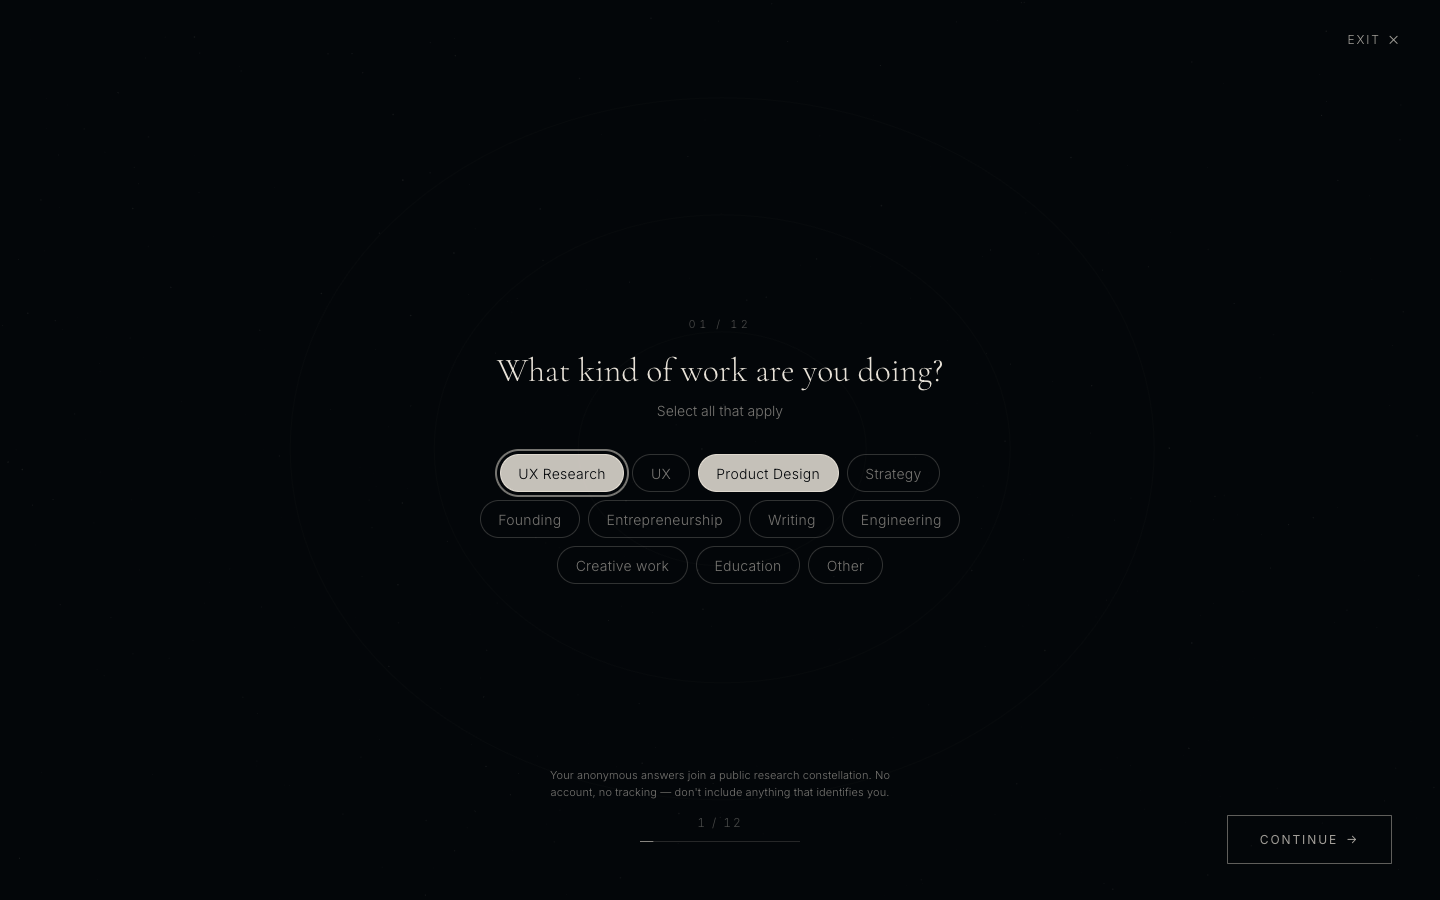
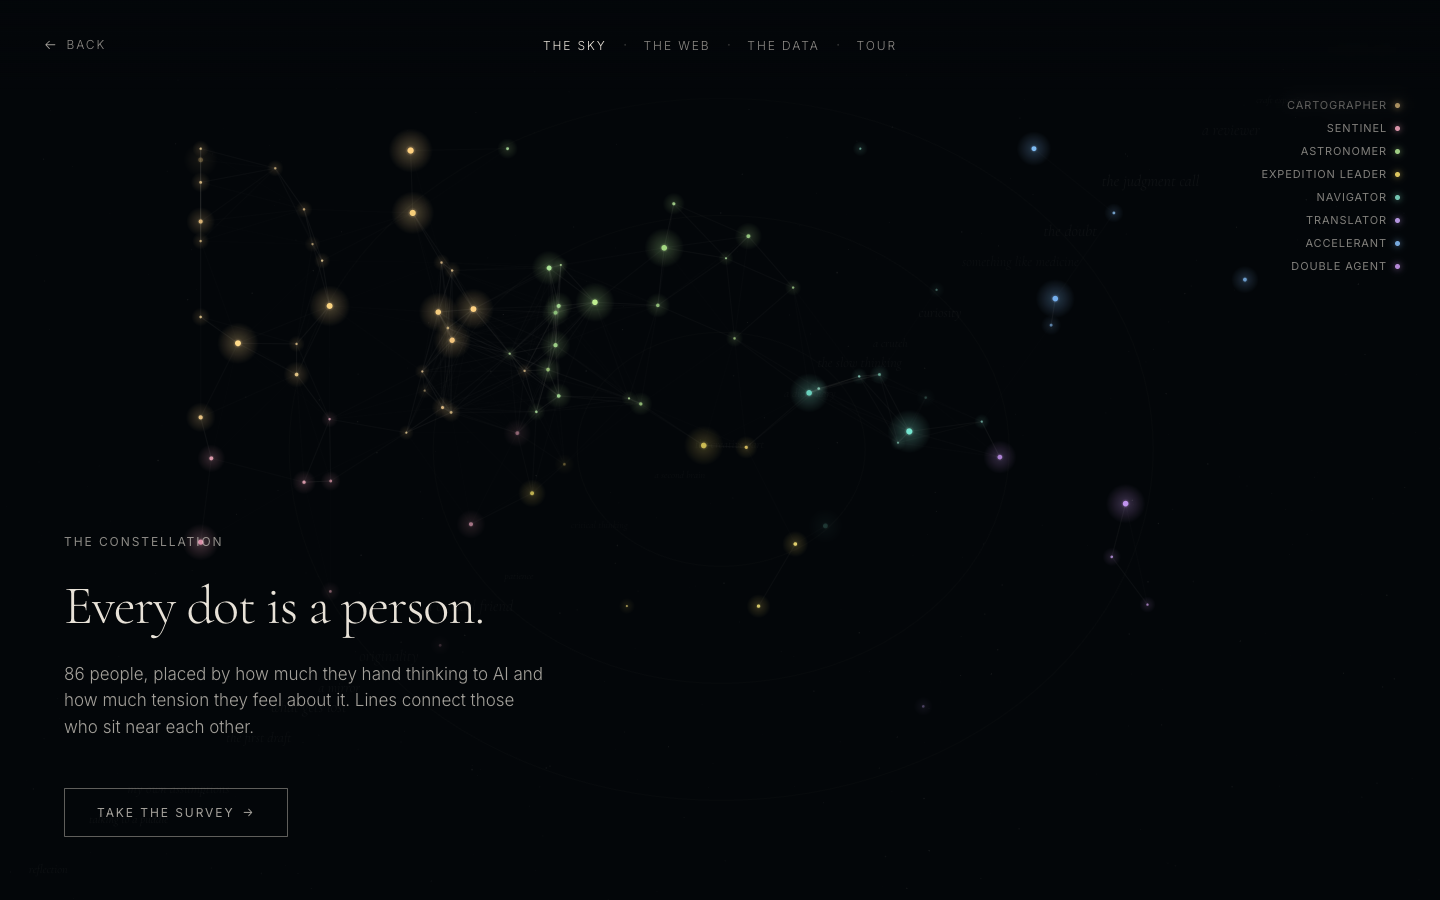
These are the shipped states from the live site. One question fills the screen, the result stays bounded to the model, and the constellation remains visible as the shared context.
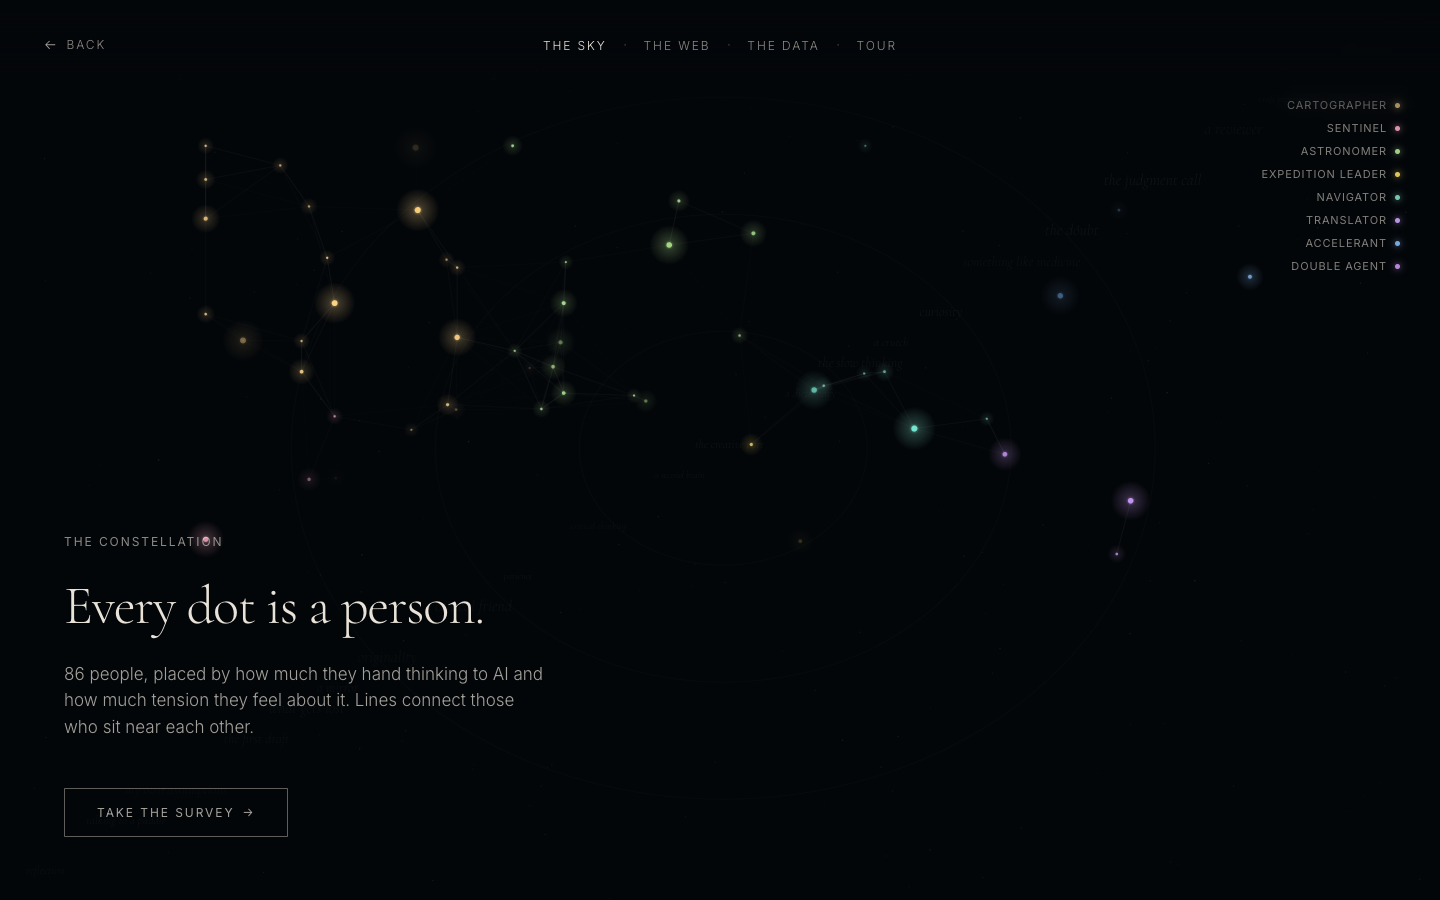
The aggregate view reads as a story, not a dashboard dump.
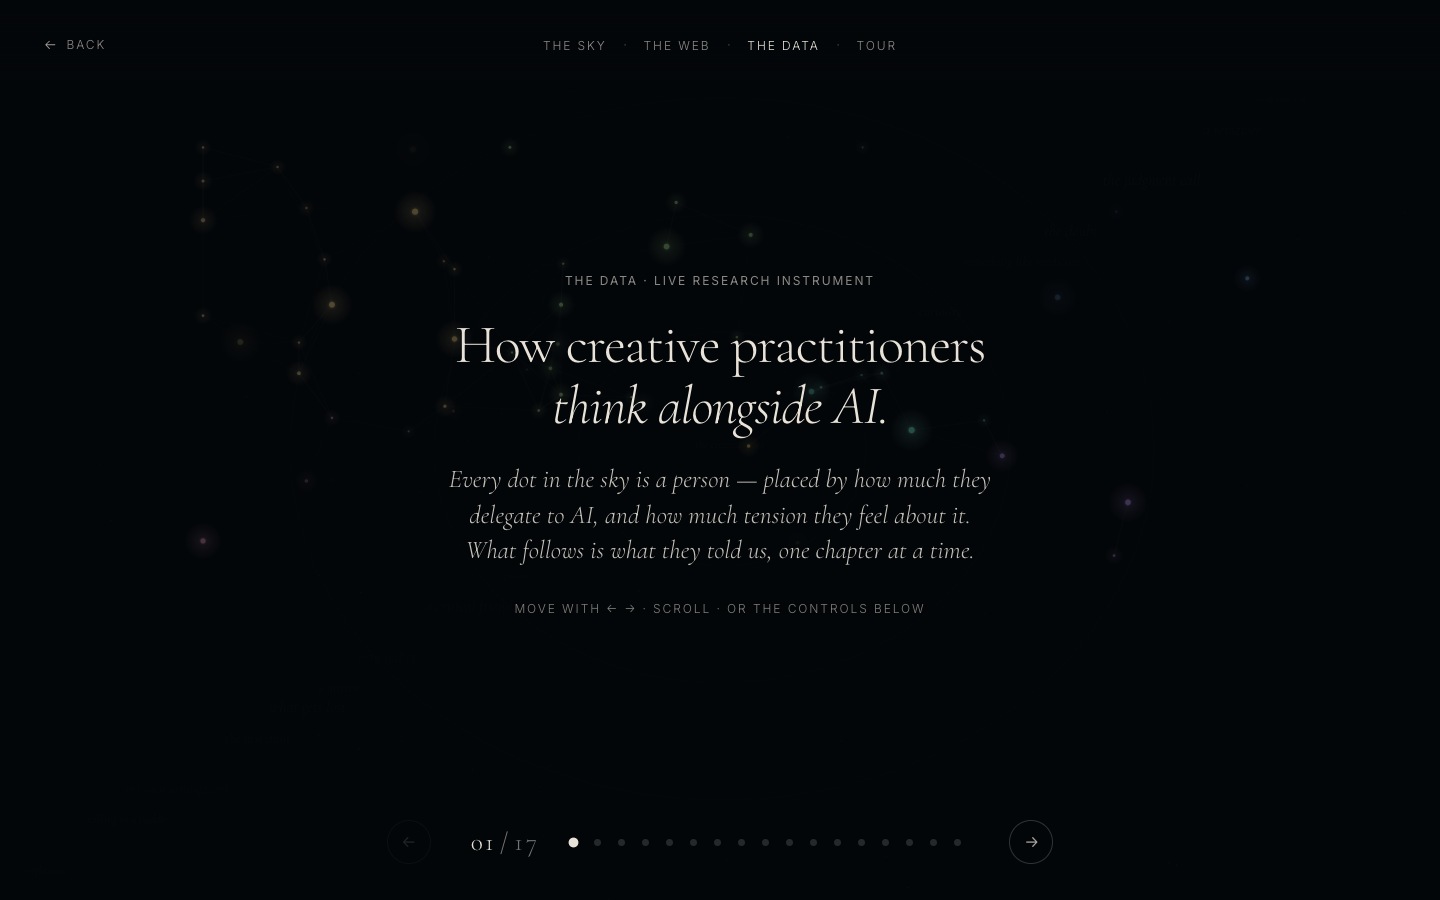
The data route contains 17 slides. One overview is followed by eight chapter dividers and eight instruments, each answering one named research question.
Who is here
Fields and AI tools
Where people sit
Profile distribution
The metaphors
Force-directed relation graph
Where thinking comes from
Ownership distribution
Habits of reaching
Three seven-point questions
What feels at risk
Ranked risk responses
What people want to keep
Verbatim protection answers
The ownership paradox
Two-axis tension map
The research owner can add new responses without a developer.
The browser uploader and command-line importer use the same parser and row conversion. Nothing writes until the researcher sees what is new.
- 01
Export
Download new responses from Tally as CSV.
- 02
Upload
Drop the file into the browser maintenance route.
- 03
Validate
Check the required columns before any row is considered.
- 04
Classify
Run the same delegation, tension, and profile calculation used by the participant flow.
- 05
Deduplicate
Compare answer fingerprints and separate existing rows from new rows.
- 06
Preview and insert
Show totals and commit only the confirmed new rows.
Branch: Invalid files stop at preview with a correction message and no write.
/admin- Purpose
- Let the research owner maintain the dataset without editing code.
- Primary action
- Review new rows
- States
- Empty, validating, preview, invalid, inserted
Why this belongs in the case study
Handoff is part of the product. The repository includes a plain-language editing guide, content signposts, a browser upload route, validation, a preview state, deduplication, friendly recovery copy, and a reversible Git and Vercel workflow.
The field paints first. The network arrives second.
The app renders from the local seed immediately, then loads the live client after first paint. Survey logic, profile calculation, Canvas rendering, data storytelling, and response maintenance remain separate modules.
Intro · Survey · Processing · Profile · Star sign · Email · Thank you · Data · Web
Persists answers across the 12-question journey and back navigation
Calculates delegation and tension, then assigns one of eight bounded regions
Canvas field renders respondents, relations, hover states, and the selected person
Seventeen slides alternate chapter framing with eight aggregate instruments
Loads the 55-response seed first, then fetches, inserts, and polls Supabase
The result is not the profile. It is the room the answers make together.
The shipped product joins the participant experience, the shared respondent field, the aggregate research story, and the maintenance workflow in one system.
Evidence boundary: the live product and repository establish the interaction, calculations, seeded data, Supabase path, data instruments, and import workflow. They do not establish psychometric validity, a representative sample, or predictive power.